Testing our K Nearest Neighbors classifier
Welcome to the 18th part of our Machine Learning with Python tutorial series, where we've just written our own K Nearest Neighbors classification algorithm, and now we're ready to test it against some actual data. To start, we're going to be using the breast cancer data from earlier in the tutorial. If you do not have it, go back to part 13 and grab the data.
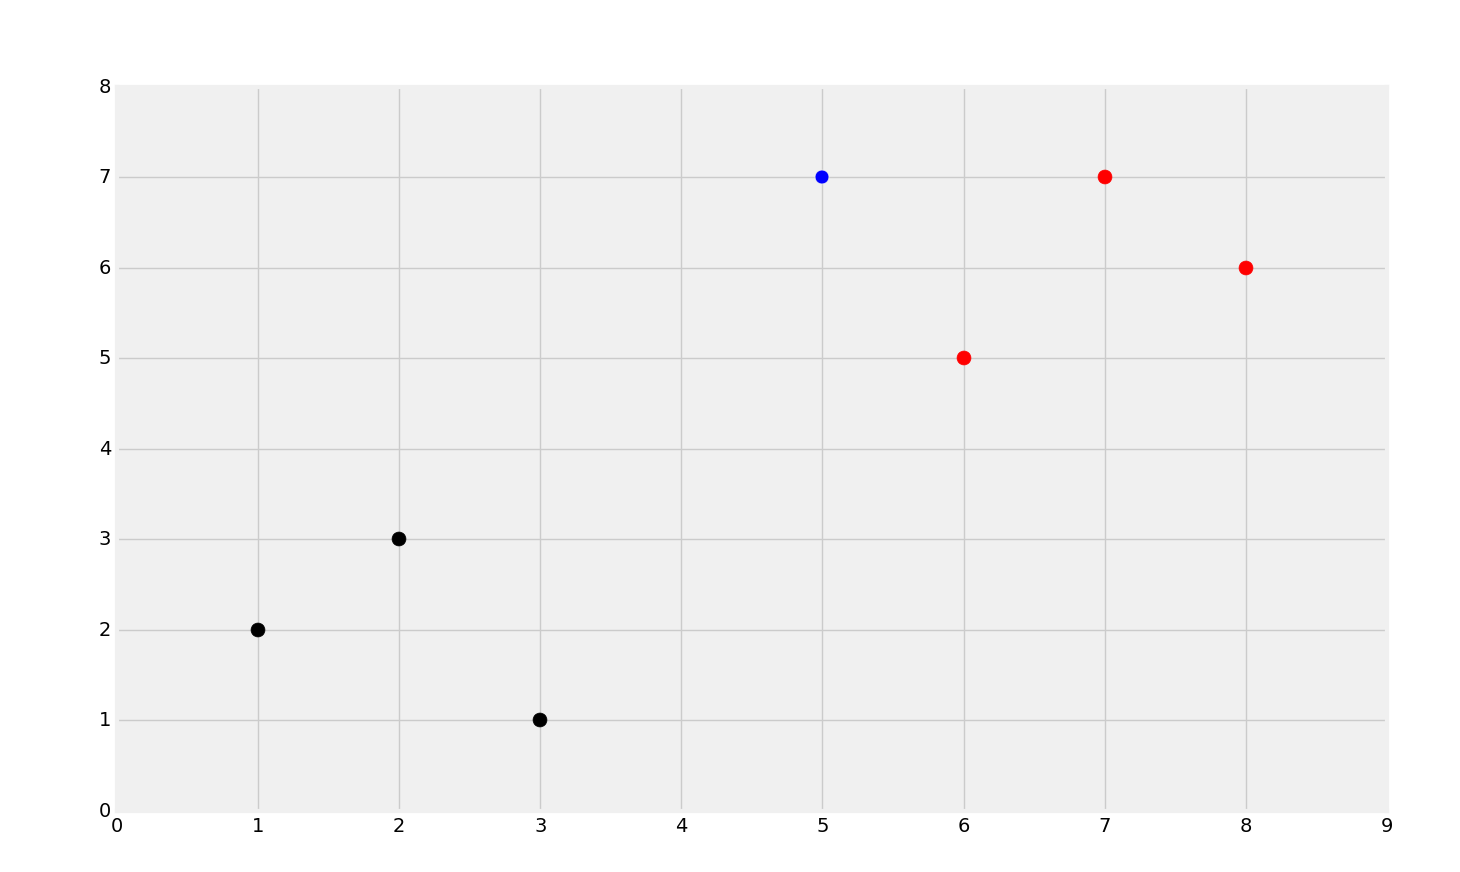
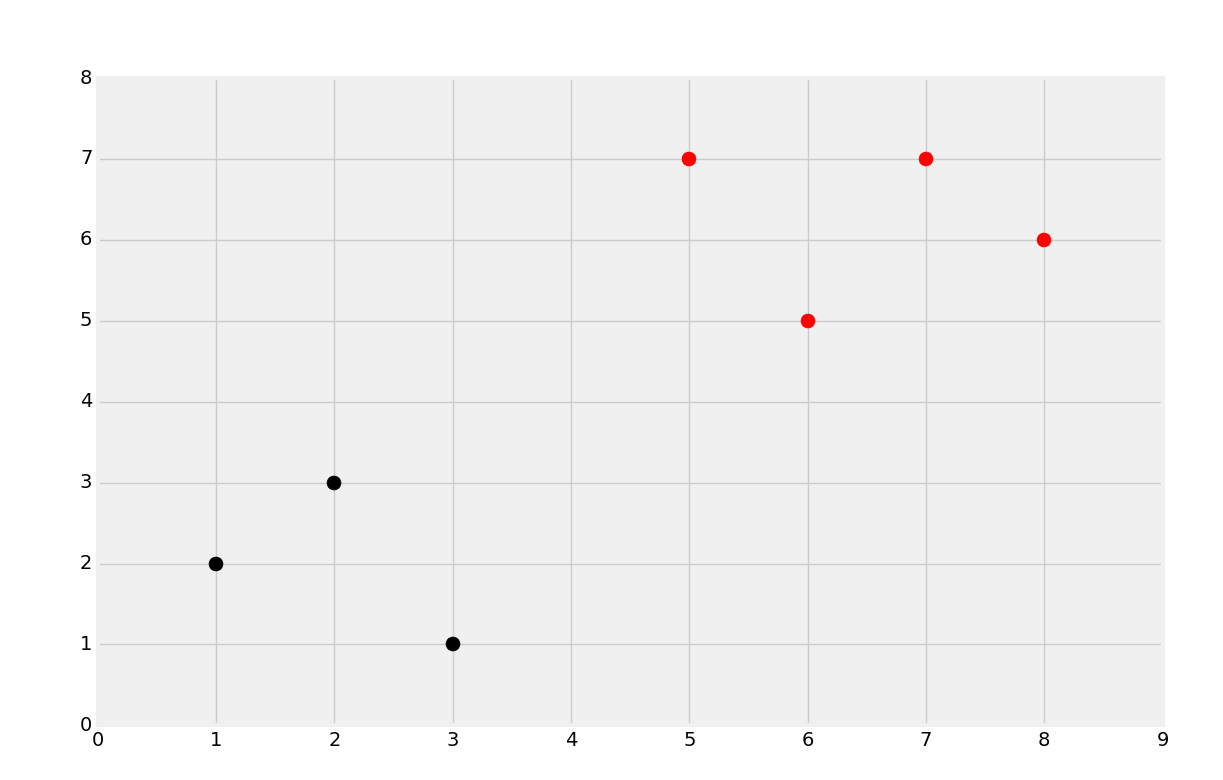
So far, our algorithm has taken data like:

Where the blue dot is the unknown data, run the algorithm, and correctly classify the data:

Now, we're going to revisit the breast cancer dataset that tracked tumor attributes and classified them as benign or malignant. The Scikit-Learn K Nearest Neighbors gave us ~95% accuracy on average, and now we're going to test our own algorithm.
We will start with the following code:
import numpy as np
import warnings
from collections import Counter
import pandas as pd
import random


def k_nearest_neighbors(data, predict, k=3):
    if len(data) >= k:
        warnings.warn('K is set to a value less than total voting groups!')
    distances = []
    for group in data:
        for features in data[group]:
            euclidean_distance = np.linalg.norm(np.array(features)-np.array(predict))
            distances.append([euclidean_distance,group])
    votes = [i[1] for i in sorted(distances)[:k]]
    vote_result = Counter(votes).most_common(1)[0][0]
    return vote_result
This should all look quite familiar. Note that I am importing pandas and random. I have also removed the matplotlib imports since we will not be graphing anything. Next, we're going to load in the data:
df = pd.read_csv('breast-cancer-wisconsin.data.txt')
df.replace('?',-99999, inplace=True)
df.drop(['id'], 1, inplace=True)
full_data = df.astype(float).values.tolist()
Here, we load in the data, replace the question mark, drop the id column, and then convert the data to a list of lists. Note that we're explicitly converting the entire dataframe to float. For some reason, at least for me, some of the data points were numbers still, but of the string datatype, so that was no good.
Next, we're going to shuffle the data, and then split it up:
random.shuffle(full_data)
test_size = 0.2
train_set = {2:[], 4:[]}
test_set = {2:[], 4:[]}
train_data = full_data[:-int(test_size*len(full_data))]
test_data = full_data[-int(test_size*len(full_data)):]
First we shuffle the data (which contains both the features and labels). Then we prepare a dictionaries for the training and testing set to be populated. Next, we specify which chunk is the train_data and which is the test_data. We do this by selecting the first 80% as train_data (by doing logic that says to slice the list up to the last 20%), and then we create the test_data by slicing the final 20% of the shuffled data.
Now we populate the dictionaries. If it is not clear, the dictionaries have two keys: 2 and 4. The 2 is for the benign tumors (the same value the actual dataset used), and the 4 is for malignant tumors, same as the data. We're hard coding this, but one could take the classification column, and create a dictionary like this with keys that were assigned by unique column values from the class column. We're just going to keep it simple for now, however.
for i in train_data:
    train_set[i[-1]].append(i[:-1])

for i in test_data:
    test_set[i[-1]].append(i[:-1])
Now we have dictionaries populated in the same way that we had our testing set, where the key is the class, and the values are the attributes.
Finally, training and testing time! With KNN, these steps basically go together, since the "train" part is simply having points in memory, and the "test" part is comparing distances:
correct = 0
total = 0

for group in test_set:
    for data in test_set[group]:
        vote = k_nearest_neighbors(train_set, data, k=5)
        if group == vote:
            correct += 1
        total += 1
print('Accuracy:', correct/total)
Now, we first iterate through the groups (the classes, 2 or 4, also the keys in the dictionary) in the test set, then we go through each datapoint, feeding that datapoint through to our custom k_nearest_neighbors, along with our training data, train_set, and then our choice for k, which is 5. I chose 5 purely because that's the default for the Scikit Learn KNeighborsClassifier. Thus, our full code up to this point:
import numpy as np
import matplotlib.pyplot as plt
from matplotlib import style
import warnings
from collections import Counter
#dont forget this
import pandas as pd
import random
style.use('fivethirtyeight')

def k_nearest_neighbors(data, predict, k=3):
    if len(data) >= k:
        warnings.warn('K is set to a value less than total voting groups!')
    distances = []
    for group in data:
        for features in data[group]:
            euclidean_distance = np.linalg.norm(np.array(features)-np.array(predict))
            distances.append([euclidean_distance,group])
    votes = [i[1] for i in sorted(distances)[:k]]
    vote_result = Counter(votes).most_common(1)[0][0]
    return vote_result

df = pd.read_csv('breast-cancer-wisconsin.data.txt')
df.replace('?',-99999, inplace=True)
df.drop(['id'], 1, inplace=True)
full_data = df.astype(float).values.tolist()

random.shuffle(full_data)

test_size = 0.2
train_set = {2:[], 4:[]}
test_set = {2:[], 4:[]}
train_data = full_data[:-int(test_size*len(full_data))]
test_data = full_data[-int(test_size*len(full_data)):]

for i in train_data:
    train_set[i[-1]].append(i[:-1])

for i in test_data:
    test_set[i[-1]].append(i[:-1])

correct = 0
total = 0

for group in test_set:
    for data in test_set[group]:
        vote = k_nearest_neighbors(train_set, data, k=5)
        if group == vote:
            correct += 1
        total += 1
print('Accuracy:', correct/total)
-
Practical Machine Learning Tutorial with Python Introduction
-
Regression - Intro and Data
-
Regression - Features and Labels
-
Regression - Training and Testing
-
Regression - Forecasting and Predicting
-
Pickling and Scaling
-
Regression - Theory and how it works
-
Regression - How to program the Best Fit Slope
-
Regression - How to program the Best Fit Line
-
Regression - R Squared and Coefficient of Determination Theory
-
Regression - How to Program R Squared
-
Creating Sample Data for Testing
-
Classification Intro with K Nearest Neighbors
-
Applying K Nearest Neighbors to Data
-
Euclidean Distance theory
-
Creating a K Nearest Neighbors Classifer from scratch
-
Creating a K Nearest Neighbors Classifer from scratch part 2
-
Testing our K Nearest Neighbors classifier
-
Final thoughts on K Nearest Neighbors
-
Support Vector Machine introduction
-
Vector Basics
-
Support Vector Assertions
-
Support Vector Machine Fundamentals
-
Constraint Optimization with Support Vector Machine
-
Beginning SVM from Scratch in Python
-
Support Vector Machine Optimization in Python
-
Support Vector Machine Optimization in Python part 2
-
Visualization and Predicting with our Custom SVM
-
Kernels Introduction
-
Why Kernels
-
Soft Margin Support Vector Machine
-
Kernels, Soft Margin SVM, and Quadratic Programming with Python and CVXOPT
-
Support Vector Machine Parameters
-
Machine Learning - Clustering Introduction
-
Handling Non-Numerical Data for Machine Learning
-
K-Means with Titanic Dataset
-
K-Means from Scratch in Python
-
Finishing K-Means from Scratch in Python
-
Hierarchical Clustering with Mean Shift Introduction
-
Mean Shift applied to Titanic Dataset
-
Mean Shift algorithm from scratch in Python
-
Dynamically Weighted Bandwidth for Mean Shift
-
Introduction to Neural Networks
-
Installing TensorFlow for Deep Learning - OPTIONAL
-
Introduction to Deep Learning with TensorFlow
-
Deep Learning with TensorFlow - Creating the Neural Network Model
-
Deep Learning with TensorFlow - How the Network will run
-
Deep Learning with our own Data
-
Simple Preprocessing Language Data for Deep Learning
-
Training and Testing on our Data for Deep Learning
-
10K samples compared to 1.6 million samples with Deep Learning
-
How to use CUDA and the GPU Version of Tensorflow for Deep Learning
-
Recurrent Neural Network (RNN) basics and the Long Short Term Memory (LSTM) cell
-
RNN w/ LSTM cell example in TensorFlow and Python
-
Convolutional Neural Network (CNN) basics
-
Convolutional Neural Network CNN with TensorFlow tutorial
-
TFLearn - High Level Abstraction Layer for TensorFlow Tutorial
-
Using a 3D Convolutional Neural Network on medical imaging data (CT Scans) for Kaggle
-
Classifying Cats vs Dogs with a Convolutional Neural Network on Kaggle
-
Using a neural network to solve OpenAI's CartPole balancing environment
