Live Updating Graphs with Matplotlib Tutorial
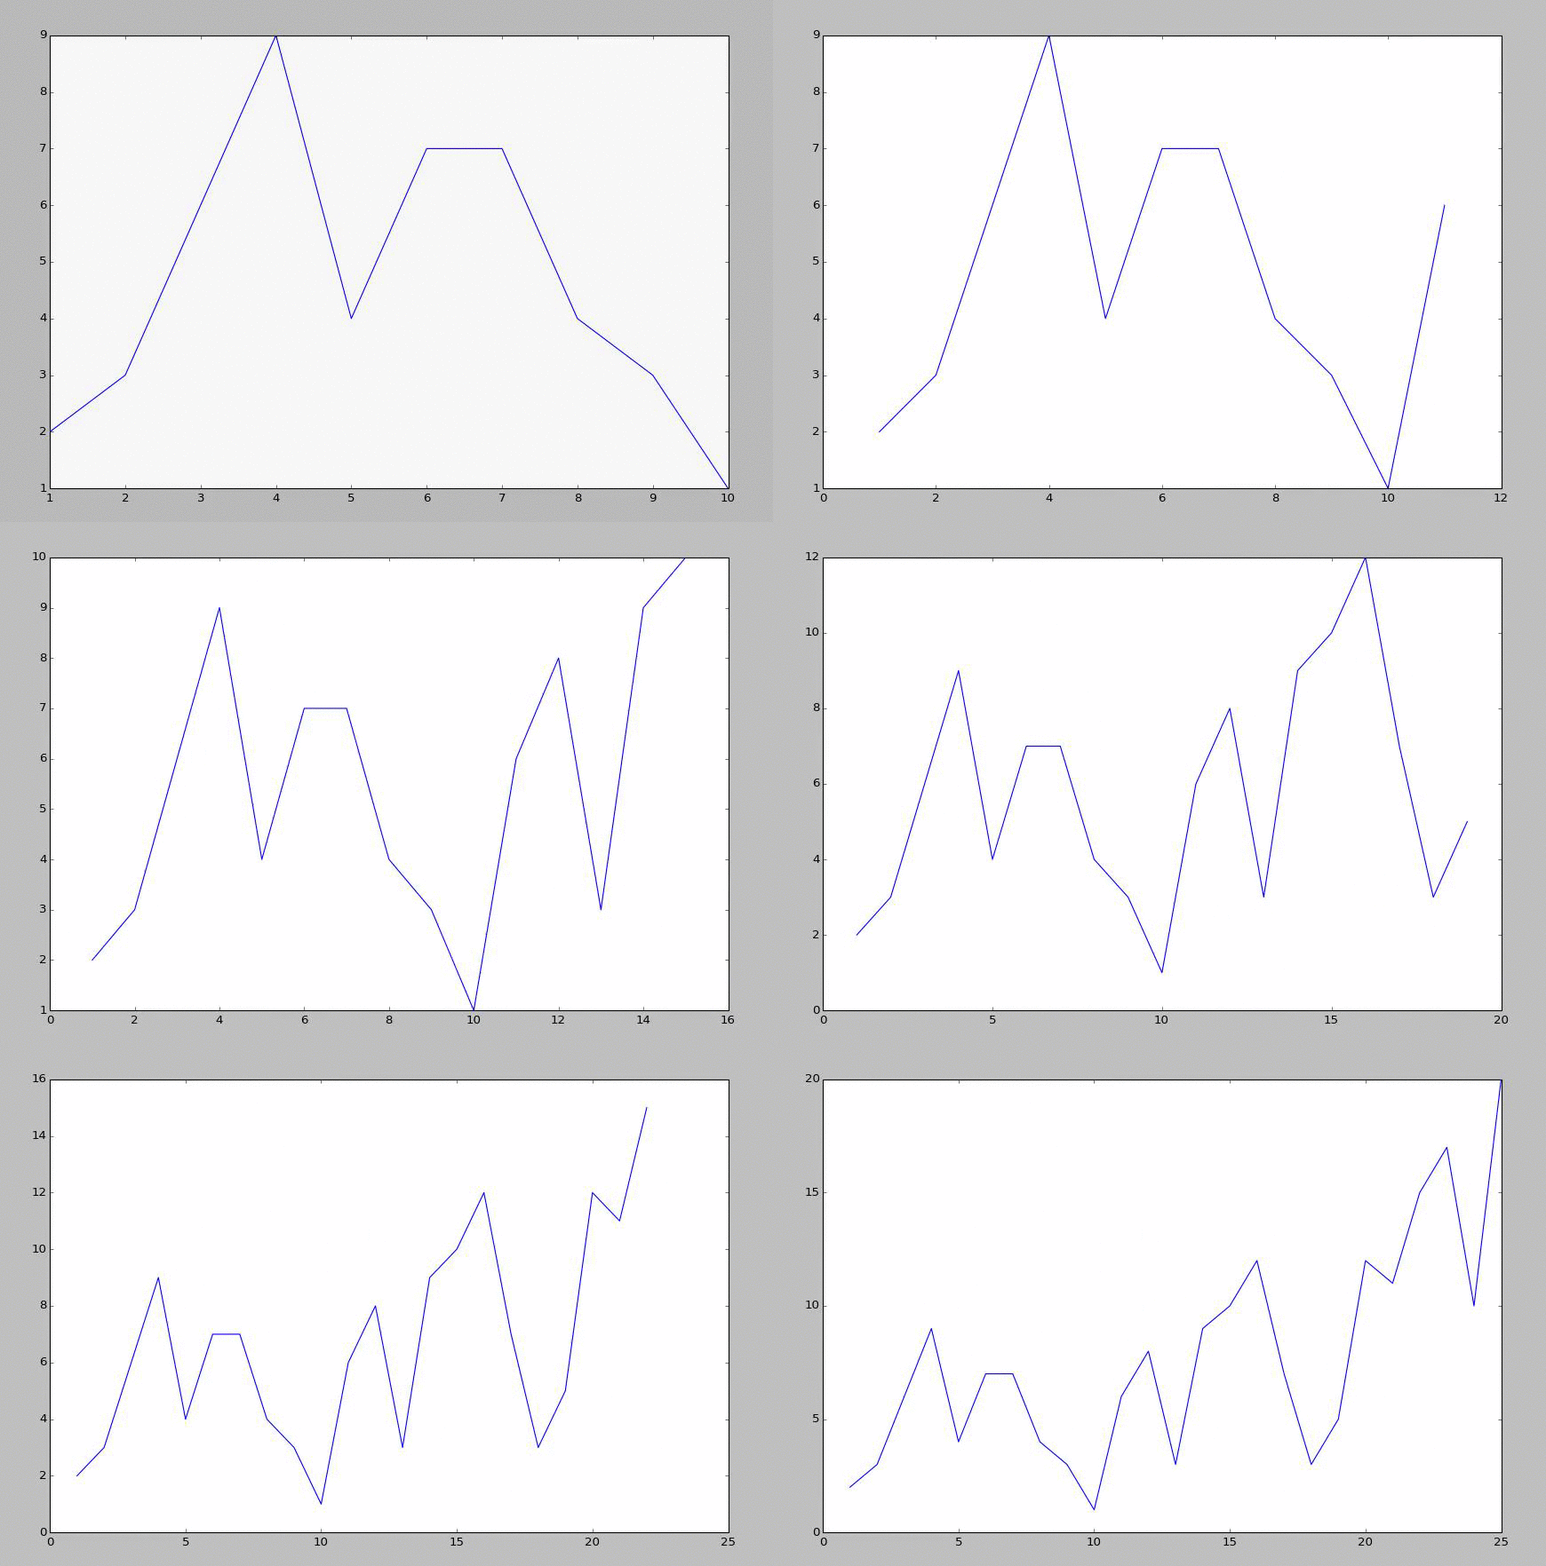
A popular question is how to get live-updating graphs in Python and Matplotlib. Luckily for us, the creator of Matplotlib has even created something to help us do just that. This is the matplotlib.animation function. This video and the subsequent video shows you the animation function, how it works, and gives an example.
Here is an example file of data you can use to start with:
1,2
2,3
3,6
4,9
5,4
6,7
7,7
8,4
9,3
10,7
From here, we create a script that will generate a matplotlib graph, then, using animate, read the sample file, and re-draw the graph. Any time there is an update, this will give us the new graph. If there is no update, then it will look the same. Think of it a lot like FPS (frames per second) in things like games. The updates are fixed, but you can do many updates a second, or just do one update every 5 seconds... etc.
Here is some sample code, assuming you saved the above text to "sampleText.txt"
import matplotlib.pyplot as plt
import matplotlib.animation as animation
import time

fig = plt.figure()
ax1 = fig.add_subplot(1,1,1)

def animate(i):
    pullData = open("sampleText.txt","r").read()
    dataArray = pullData.split('\n')
    xar = []
    yar = []
    for eachLine in dataArray:
        if len(eachLine)>1:
            x,y = eachLine.split(',')
            xar.append(int(x))
            yar.append(int(y))
    ax1.clear()
    ax1.plot(xar,yar)
ani = animation.FuncAnimation(fig, animate, interval=1000)
plt.show()
-
Matplotlib Crash Course
-
3D graphs in Matplotlib
-
3D Scatter Plot with Python and Matplotlib
-
More 3D scatter-plotting with custom colors
-
3D Barcharts
-
3D Plane wireframe Graph
-
Live Updating Graphs with Matplotlib Tutorial
-
Modify Data Granularity for Graphing Data
-
Geographical Plotting with Basemap and Python p. 1
-
Geographical Plotting with Basemap and Python p. 2
-
Geographical Plotting with Basemap and Python p. 3
-
Geographical Plotting with Basemap and Python p. 4
-
Geographical Plotting with Basemap and Python p. 5
-
Advanced Matplotlib Series (videos and ending source only)
