Geographical Plotting with Basemap and Python p. 4
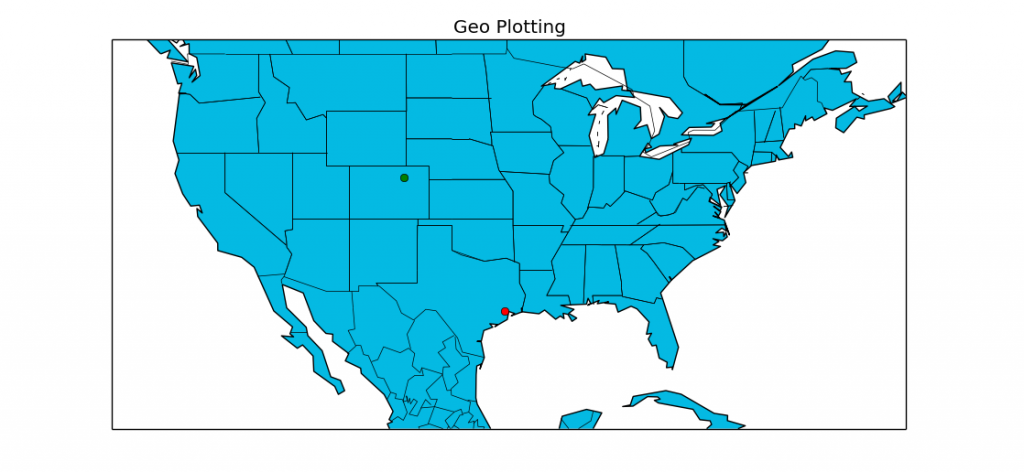
In this tutorial with Basemap, you are shown how to actually plot a plot, as well as choose a zoom level on your projection. As you can see, plotting lat and long coordinates is fairly simple if you envision them as X and Y on a plane. The only confusing part is that X, Y translates to Lon, Lat... which is the reverse of how they are normally reported.
From the video, here is the sample code:
from mpl_toolkits.basemap import Basemap
import matplotlib.pyplot as plt

def mapTut():

    m = Basemap(projection='mill',llcrnrlat=20,urcrnrlat=50,\
                llcrnrlon=-130,urcrnrlon=-60,resolution='c')
    m.drawcoastlines()
    m.drawcountries()
    m.drawstates()
    m.fillcontinents(color='#04BAE3',lake_color='#FFFFFF')
    m.drawmapboundary(fill_color='#FFFFFF')


    # Houston, Texas

    lat,lon = 29.7630556,-95.3630556
    x,y = m(lon,lat)
    m.plot(x,y, 'ro')


    lon, lat = -104.237, 40.125 # Location of Boulder

    xpt,ypt = m(lon,lat)
    m.plot(xpt,ypt, 'go')


    plt.title("Geo Plotting")
    plt.show()


mapTut()
The above code will generate a map in Matplotlib and Basemap with coordinates plotted for Houston TX and Boulder CO.
-
Matplotlib Crash Course
-
3D graphs in Matplotlib
-
3D Scatter Plot with Python and Matplotlib
-
More 3D scatter-plotting with custom colors
-
3D Barcharts
-
3D Plane wireframe Graph
-
Live Updating Graphs with Matplotlib Tutorial
-
Modify Data Granularity for Graphing Data
-
Geographical Plotting with Basemap and Python p. 1
-
Geographical Plotting with Basemap and Python p. 2
-
Geographical Plotting with Basemap and Python p. 3
-
Geographical Plotting with Basemap and Python p. 4
-
Geographical Plotting with Basemap and Python p. 5
-
Advanced Matplotlib Series (videos and ending source only)
