Geographical Plotting with Basemap and Python p. 2
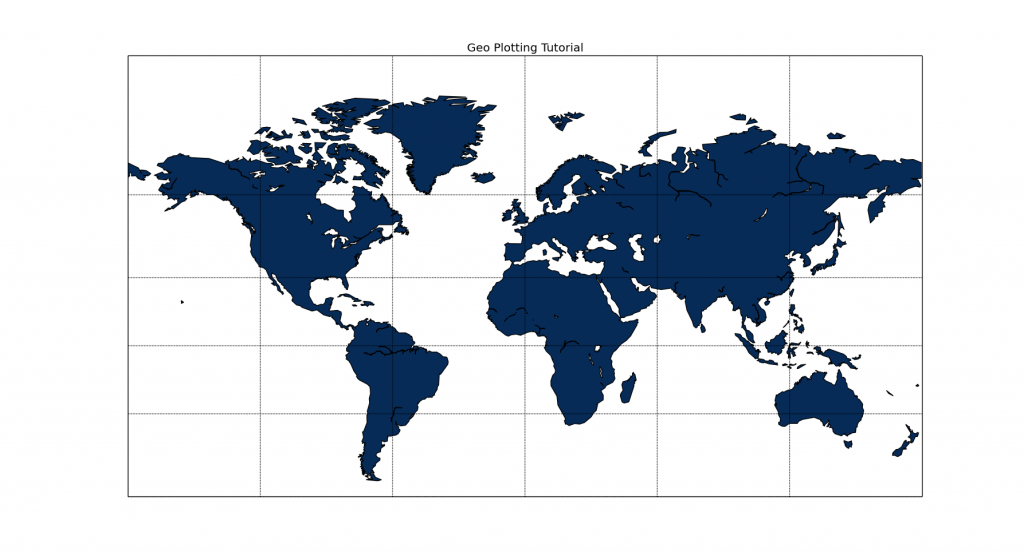
Here, we cover some more of the customization options of Python's Basemap. Here is the sample code from the video:
from mpl_toolkits.basemap import Basemap
import matplotlib.pyplot as plt
import numpy as np
# llcrnrlat,llcrnrlon,urcrnrlat,urcrnrlon
# are the lat/lon values of the lower left and upper right corners
# of the map.
# resolution = 'c' means use crude resolution coastlines
# you can also have 'l' for low, then 'h' for high. Unless coastlines are
# really important to you, or lakes, you should just use c for crude.
m = Basemap(projection='mill',llcrnrlat=-60,urcrnrlat=90,\
            llcrnrlon=-180,urcrnrlon=180,resolution='c')
m.drawcoastlines()
m.fillcontinents(color='#072B57',lake_color='#FFFFFF')
# draw parallels and meridians.

m.drawparallels(np.arange(-90.,91.,30.))
m.drawmeridians(np.arange(-180.,181.,60.))

m.drawmapboundary(fill_color='#FFFFFF')
plt.title("Geo Plotting Tutorial")
plt.show()
-
Matplotlib Crash Course
-
3D graphs in Matplotlib
-
3D Scatter Plot with Python and Matplotlib
-
More 3D scatter-plotting with custom colors
-
3D Barcharts
-
3D Plane wireframe Graph
-
Live Updating Graphs with Matplotlib Tutorial
-
Modify Data Granularity for Graphing Data
-
Geographical Plotting with Basemap and Python p. 1
-
Geographical Plotting with Basemap and Python p. 2
-
Geographical Plotting with Basemap and Python p. 3
-
Geographical Plotting with Basemap and Python p. 4
-
Geographical Plotting with Basemap and Python p. 5
-
Advanced Matplotlib Series (videos and ending source only)
