Geographical Plotting with Basemap and Python p. 1
Now that you are pretty much a pro at all other things Matplotlib, it is time to learn how to spread your wings a bit and begin working with geo-plotting on maps, using basemap. Basemap works alongside Matplotlib to allow you to plot via latitude and longitude coordinates.
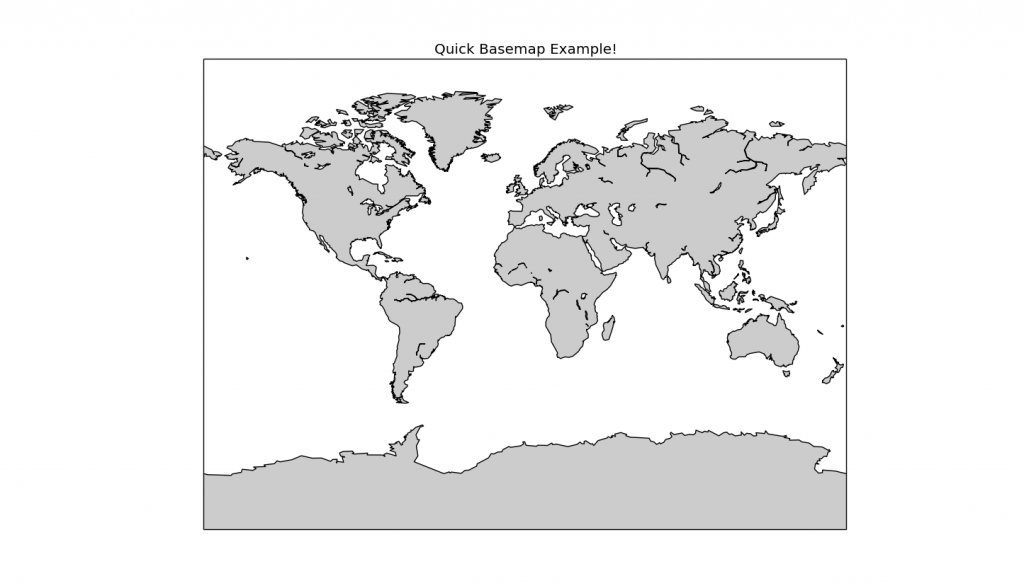
Once you have basemap installed, you can use the following code to quickly show a simple map. This will just render and display a map, but soon we'll be plotting, zooming, and more fun things!
from mpl_toolkits.basemap import Basemap
import matplotlib.pyplot as plt

m = Basemap(projection='mill',llcrnrlat=-90,urcrnrlat=90,\
            llcrnrlon=-180,urcrnrlon=180,resolution='c')
m.drawcoastlines()
m.fillcontinents()
m.drawmapboundary()
plt.title("Quick Basemap Example!")
plt.show()
-
Matplotlib Crash Course
-
3D graphs in Matplotlib
-
3D Scatter Plot with Python and Matplotlib
-
More 3D scatter-plotting with custom colors
-
3D Barcharts
-
3D Plane wireframe Graph
-
Live Updating Graphs with Matplotlib Tutorial
-
Modify Data Granularity for Graphing Data
-
Geographical Plotting with Basemap and Python p. 1
-
Geographical Plotting with Basemap and Python p. 2
-
Geographical Plotting with Basemap and Python p. 3
-
Geographical Plotting with Basemap and Python p. 4
-
Geographical Plotting with Basemap and Python p. 5
-
Advanced Matplotlib Series (videos and ending source only)
